Anomaly Detection in Aerospace Flight Telemetry Data: A Python Project

Link to Project: https://github.com/Himashi-Karunathilake/Anomaly-Detector.gitIntroduction
In the modern era of aviation, ensuring the safety and security of aerospace systems is of vital importance. Aerospace flight telemetry data plays a crucial role in monitoring and analyzing the performance of aircrafts during flights. The early detection of anomalies in this telemetry data can provide valuable insights into potential security threats or abnormal behavior that might compromise the safety of the flight. These anomalies range from technical malfunctions to malicious activities that need immediate attention. This article delves into a small-scale Python implementation that aims to tackle this critical challenge by detecting anomalies in flight telemetry data.
Objectives and Importance
The overarching objective of this project is to proactively identify anomalies within aerospace flight telemetry data, thereby enabling aviation professionals to take timely and informed actions. These anomalies could range from abnormal wind speed and orientation readings to irregular battery voltage or acceleration values. By detecting these anomalies, aviation experts can promptly identify potential threats to the aircraft’s operational integrity or cyberattacks that might compromise its safety.
Use and Applications
The application of anomaly detection in aerospace flight telemetry data holds extensive utility across various aviation domains. Primarily, it provides the capability to identify, in real-time, any abnormal behavior exhibited by aircraft during flights. By continuously monitoring and analyzing telemetry data, this implementation assists in the early detection of anomalies that might otherwise go unnoticed. Subsequently, aviation personnel can respond promptly to mitigate potential risks and ensure the safety of passengers, crew, and aircraft systems. Furthermore, this approach is not limited to passenger flights but extends to a broad spectrum of aerospace applications, including military aviation, unmanned aerial vehicles (UAVs), and space missions.
Dataset Overview
           ~~~~~~~~~~ INFORMATION ON THE DATASET ~~~~~~~~~~

Link to Dataset  https://opendatalab.com/Data_Collected_with_Package_etc

Title            In-flight positional and energy use data set of a DJI Matrice
                 100 quadcopter for small package delivery

Authors          Rodrigues, Thiago A and Patrikar, Jay and Choudhry, Arnav and
                 Feldgoise, Jacob and Arcot, Vaibhav and Gahlaut, Aradhana and
                 Lau, Sophia and Moon, Brady and Wagner, Bastian and Matthews,
                 H Scott and others

Journal          Scientific Data

Volume           8

Number           1

Pages            1-8

Year             2021

Publisher        Nature Publishing Group
The original directory of files in the dataset contains several files, namely, parameters.csv, flights.zip, flights.csv, raw_files.zip and README.txt. In this project, we have used only the first 255712 rows of data in the flights.csv file. However, the original README.txt file too will be included in the GitHub repository for this project as it contains the contact information of the original authors of the dataset and other important information regarding the dataset.
Libraries Used
This project uses several popular Python libraries to achieve its objectives as shown below:
- Pandas: This library is used for data manipulation and analysis as it provides data structures like DataFrames to efficiently work with structured data.
- NumPy: This library is used to perform various mathematical operations on large datasets.
- Matplotlib: This library is used to create different types of plots including bar plots and scatter plots to help gain insights into our data through visualizations.
- Plotly: This library is used to create interactive visualizations.
- Seaborn: This library that is built on top of Matplotlib is used to create aesthetically pleasing and informative visualizations.
Implementation
STEP 1: Import Libraries
As the first step, we will be importing the libraries that will be used in this project.
# Import libraries
import pandas as pd
import numpy as np
import matplotlib.pyplot as plt
import plotly.express as px
import seaborn as sns
import plotly.graph_objects as go
from plotly.subplots import make_subplots
STEP 2: Load Dataset
The second step is to load the flights.csv dataset so that we can start working with our data.
# Load the dataset
data = pd.read_csv('flights.csv')
STEP 3: Data Preprocessing
The next step is to clean and preprocess the flight telemetry data and select the features that we will be working with and create a DataFrame.
# Specify the features for anomaly detection
features = ['wind_speed', 'wind_angle', 'battery_voltage', 'battery_current', 'position_x', 'position_y', 'position_z', 'orientation_x',
            'orientation_y', 'orientation_z', 'orientation_w', 'velocity_x', 'velocity_y', 'velocity_z', 'angular_x', 'angular_y', 'angular_z',
            'linear_acceleration_x', 'linear_acceleration_y', 'linear_acceleration_z', 'speed',
            'payload', 'altitude']

# Create a new DataFrame with selected features
df = data[features]
STEP 4: Detect Anomalies
Under this step, we will be detecting anomalies in the dataset using a method called Z-score, which is a statistical method that quantifies how many standard deviations a data point is away from the mean of the dataset. In other words, this means that the Z-score method measures the distance of a data point from the mean in terms of the standard deviation.
                        Z = (x − μ) / σ

Z  Z-score

x  The data point for which you want to calculate the Z-score

μ  Mean (or average) of the dataset

σ  Standard deviation of the dataset
Once we calculate the Z-score for each data point, we can then set a threshold value to determine whether a particular data point is an anomaly or not. If a Z-score of a data point exceeds the threshold, we consider the data point to be an anomaly.
# Simple anomaly detection using Z-score
def detect_anomalies_zscore(data, threshold=3):
    mean = np.mean(data)
    std = np.std(data)
    z_scores = np.abs((data - mean) / std)
    return z_scores > threshold

# Apply anomaly detection to each feature
anomalies = df.apply(detect_anomalies_zscore)
STEP 5: Visualize Anomalies
Under this step, we will be creating visualizations that summarize the data / anomalies for the convenience of interpretation.
# Summarize the number of anomalies for each feature
anomaly_counts = anomalies.sum()

# Create a bar plot of anomaly counts using Matplotlib
plt.figure(figsize=(12, 8))
bars = plt.bar(anomaly_counts.index, anomaly_counts.values)
plt.xticks(rotation=45)
plt.xlabel('Features')
plt.ylabel('Number of Anomalies')
plt.title('Anomaly Counts for Each Feature')
plt.tight_layout()
plt.show()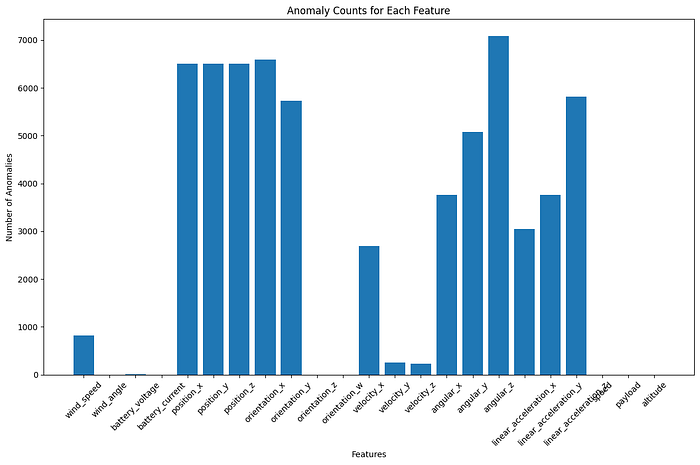
# Select pairs of features for scatter plots
scatter_pairs = [('wind_speed', 'wind_angle'),
('battery_voltage', 'battery_current'),
('velocity_x', 'velocity_y'),
('angular_x', 'angular_y'),
('linear_acceleration_x', 'linear_acceleration_y')]
# Create scatter plot graphs for selected scatter plots with anomalies highlighted
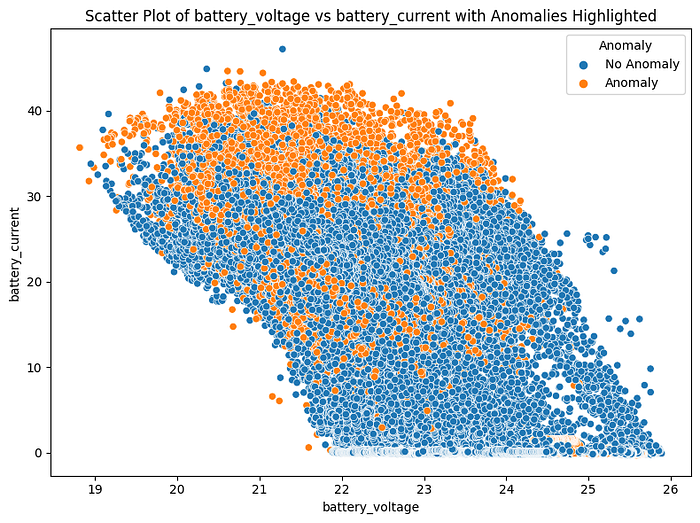
for pair in scatter_pairs:
plt.figure(figsize=(8, 6))
sns.scatterplot(data=df, x=pair[0], y=pair[1], hue=anomalies.any(axis=1))
plt.title(f'Scatter Plot of {pair[0]} vs {pair[1]} with Anomalies Highlighted')
plt.xlabel(pair[0])
plt.ylabel(pair[1])
# Manually create the legend
handles, labels = plt.gca().get_legend_handles_labels()
plt.gca().legend(handles, ['No Anomaly', 'Anomaly'], title='Anomaly', loc='upper right')
plt.tight_layout()
plt.show()A wind_speed vs wind_angle graph can reveal how changes in wind speed might be correlated with changes in wind direction / angle. Anomalies of this graph could indicate unexpected or irregular wind patterns during flight, which could affect the aircraft’s performance and stability.

A battery_voltage vs battery_current graph can reveal how the battery’s electrical characteristics change during flight. Anomalies of this graph could suggest unusual power consumption or charging patterns, which could be indicative of issues with the battery or power management system.
A velocity component graph (velocity_x vs velocity_y) can reveal how the the aircraft’s speed changes in different directions. Anomalies of this graph could suggest sudden changes in velocity components, indicating rapid shifts in the aircraft’s movement.

An angular velocity component graph (angular_x vs. angular_y) can reveal insights into the aircraft’s rotation rates. Anomalies of this graph could indicate unexpected changes in the aircraft’s orientation, potentially caused by turbulence or other external factors.

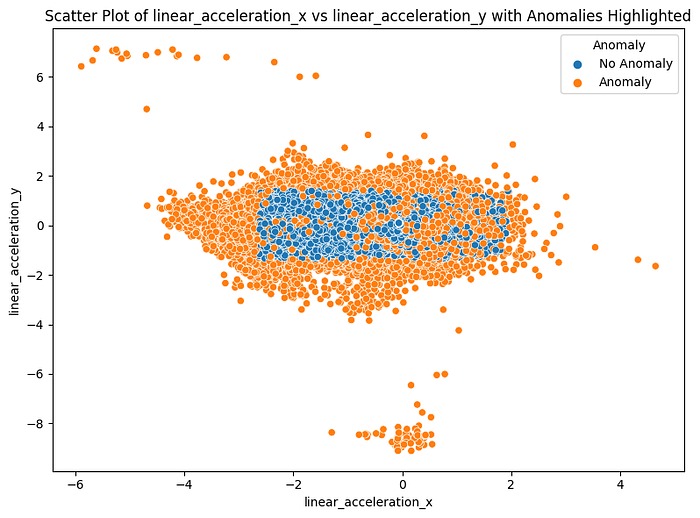
A linear acceleration component graph (linear_acceleration_x vs. linear_acceleration_y) can show how the aircraft’s acceleration changes in different directions. Anomalies of this graph could indicate sudden changes in acceleration, possibly due to maneuvers, turbulence, or other factors affecting the aircraft’s motion.
Conclusion
Building an anomaly detection system for flight data is a crucial endeavor in ensuring aviation safety and security. By employing Python and a selection of powerful libraries, we have successfully developed a simple anomaly detection solution. The integration of Pandas, NumPy, Matplotlib, and Plotly allows us to efficiently manipulate, analyze, and visualize the flight data. As aviation continues to advance, robust anomaly detection systems like the one demonstrated here play a vital role in maintaining the integrity of flight operations and ensuring the smooth and secure operation of aerospace systems.